- ↑
UTMCAP TMT - LAM Quantitative Analysis
-
Plan
- Do stuff like stock price changes. What was the news around that time, etc.
- Like example: LAM Research surged in price a lot because of earnings for other AI companies. The CapEx for these companies will naturally flow into companies like LAM. So it got priced in.
- Look at factset
- Look at beta on SPX and SOX
- Look at the correlation between LAM and SPX and SOX
- Covariances
-
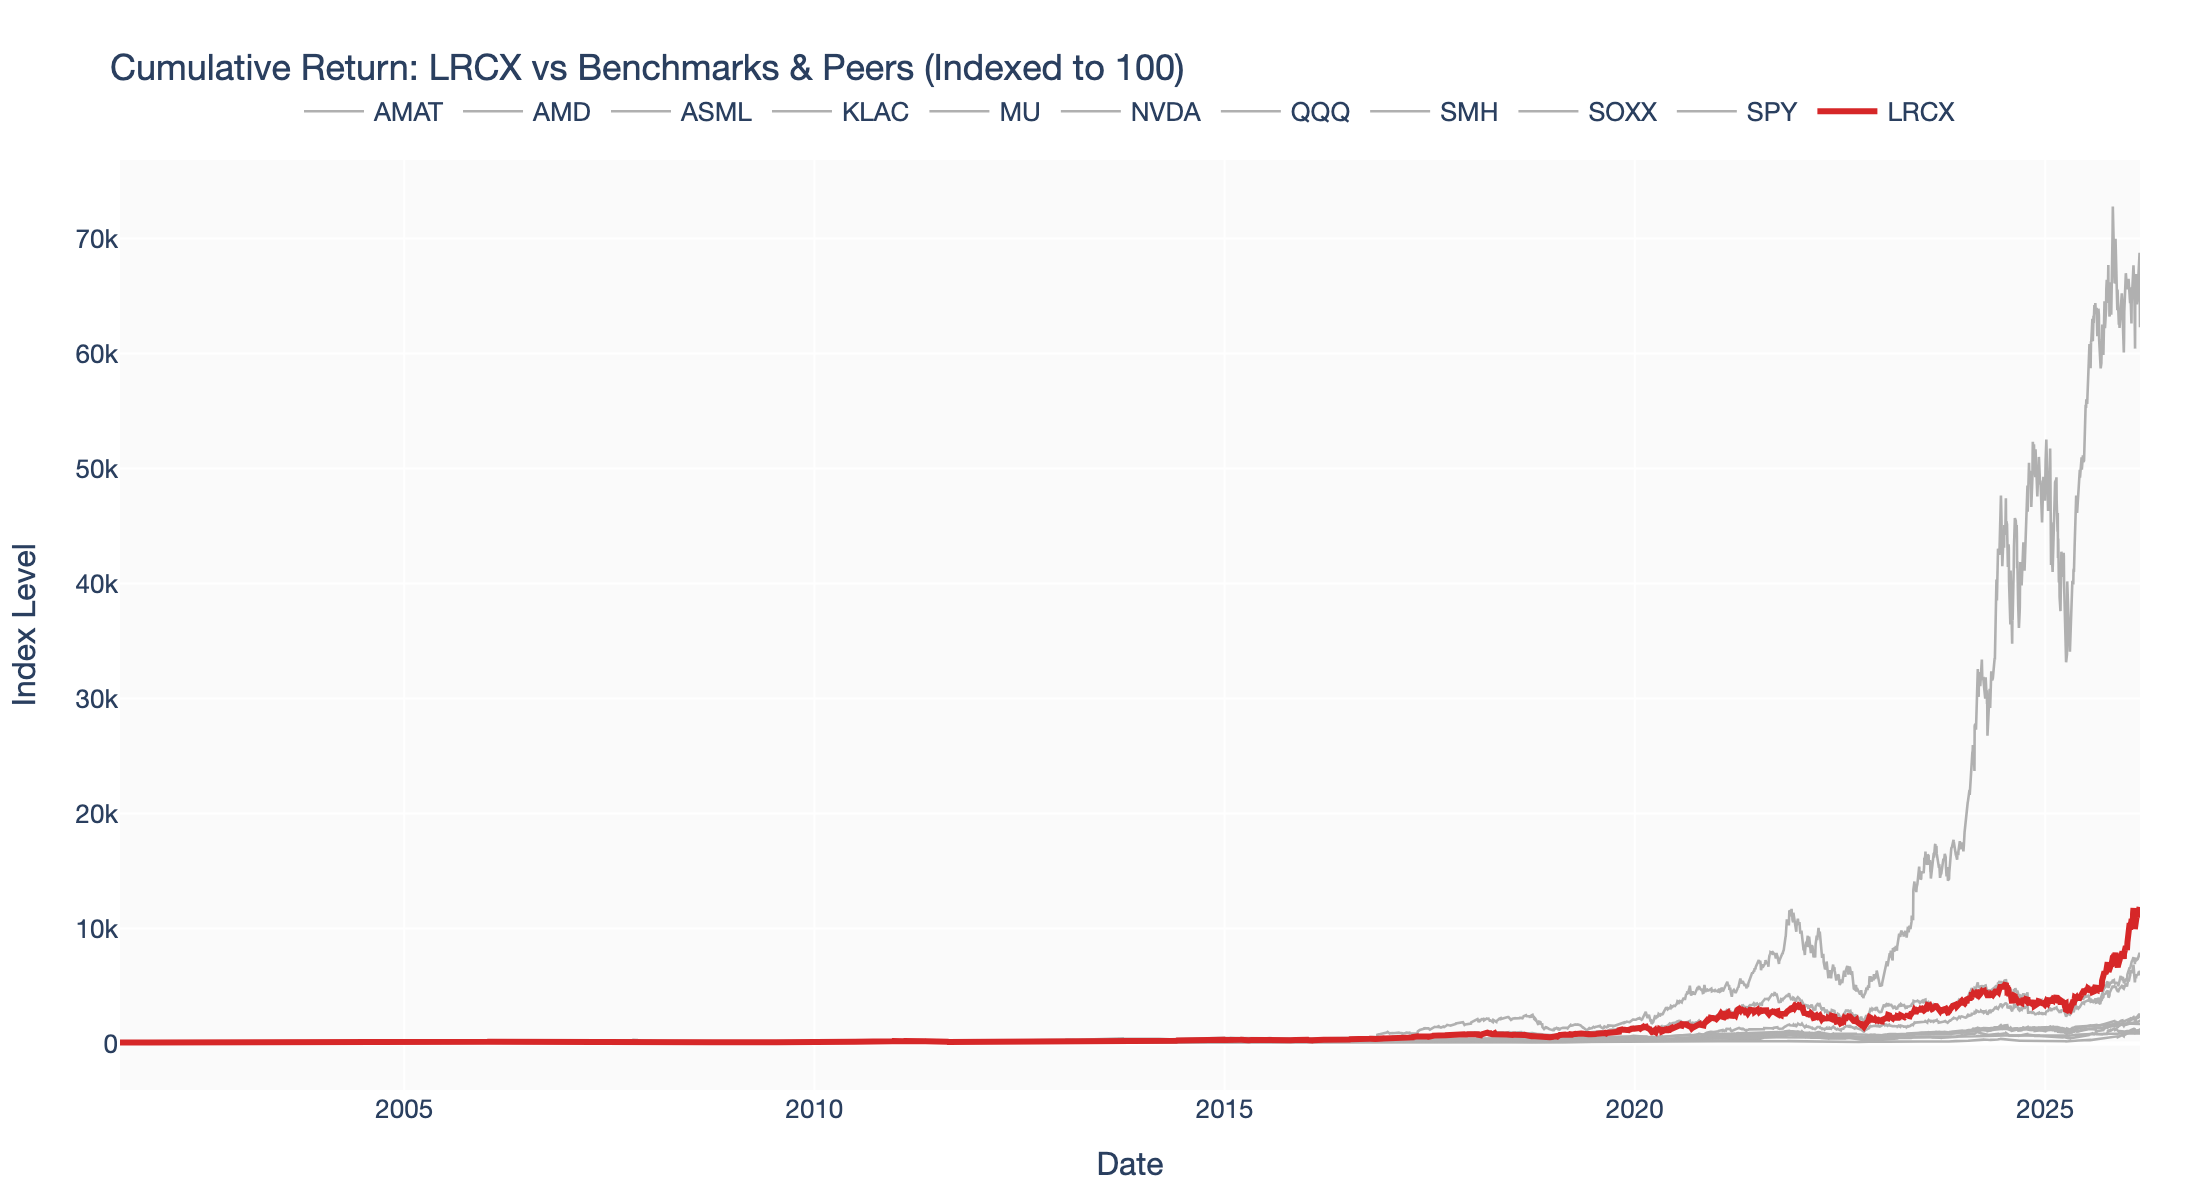
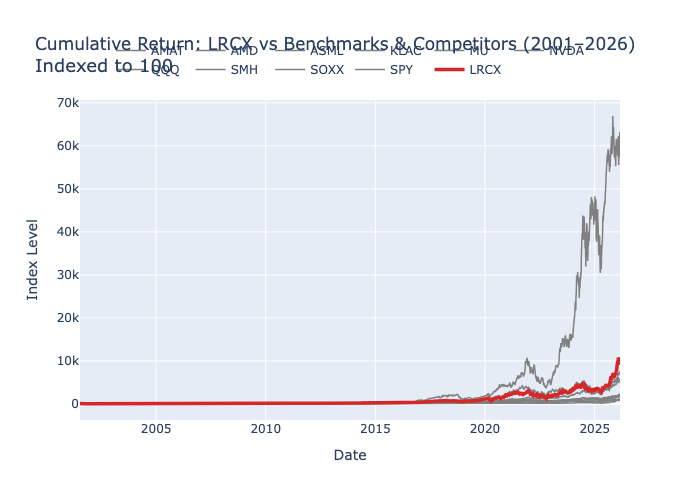
- We can see that around march 2025, when LRCX had a turn around. They had a pretty good quarter, with everything being up from the previous quarter. So we can see that the stock price surged around that time. We can also see that the stock price had a reversal around there. That coincides with tariff news being dealt with I guess. SPY had a major turnaround there too.
- Sept 2025 marks a bigger turnaround for LRCX, with the stock price surging. This is around the time when the news about the AI boom and the CapEx for AI companies being priced in. SPY also had a turnaround around that time, but it was not as significant as LRCX. Link.
LRCX — Quantitative Summary
- Source analysis:
/Users/amon/Projects/Code/UTMCAP/lrcx_quant_tearsheet.mdandlrcx_quant_tearsheet_2years.md(extracted below). - Long window (2001–2026): Ann. return
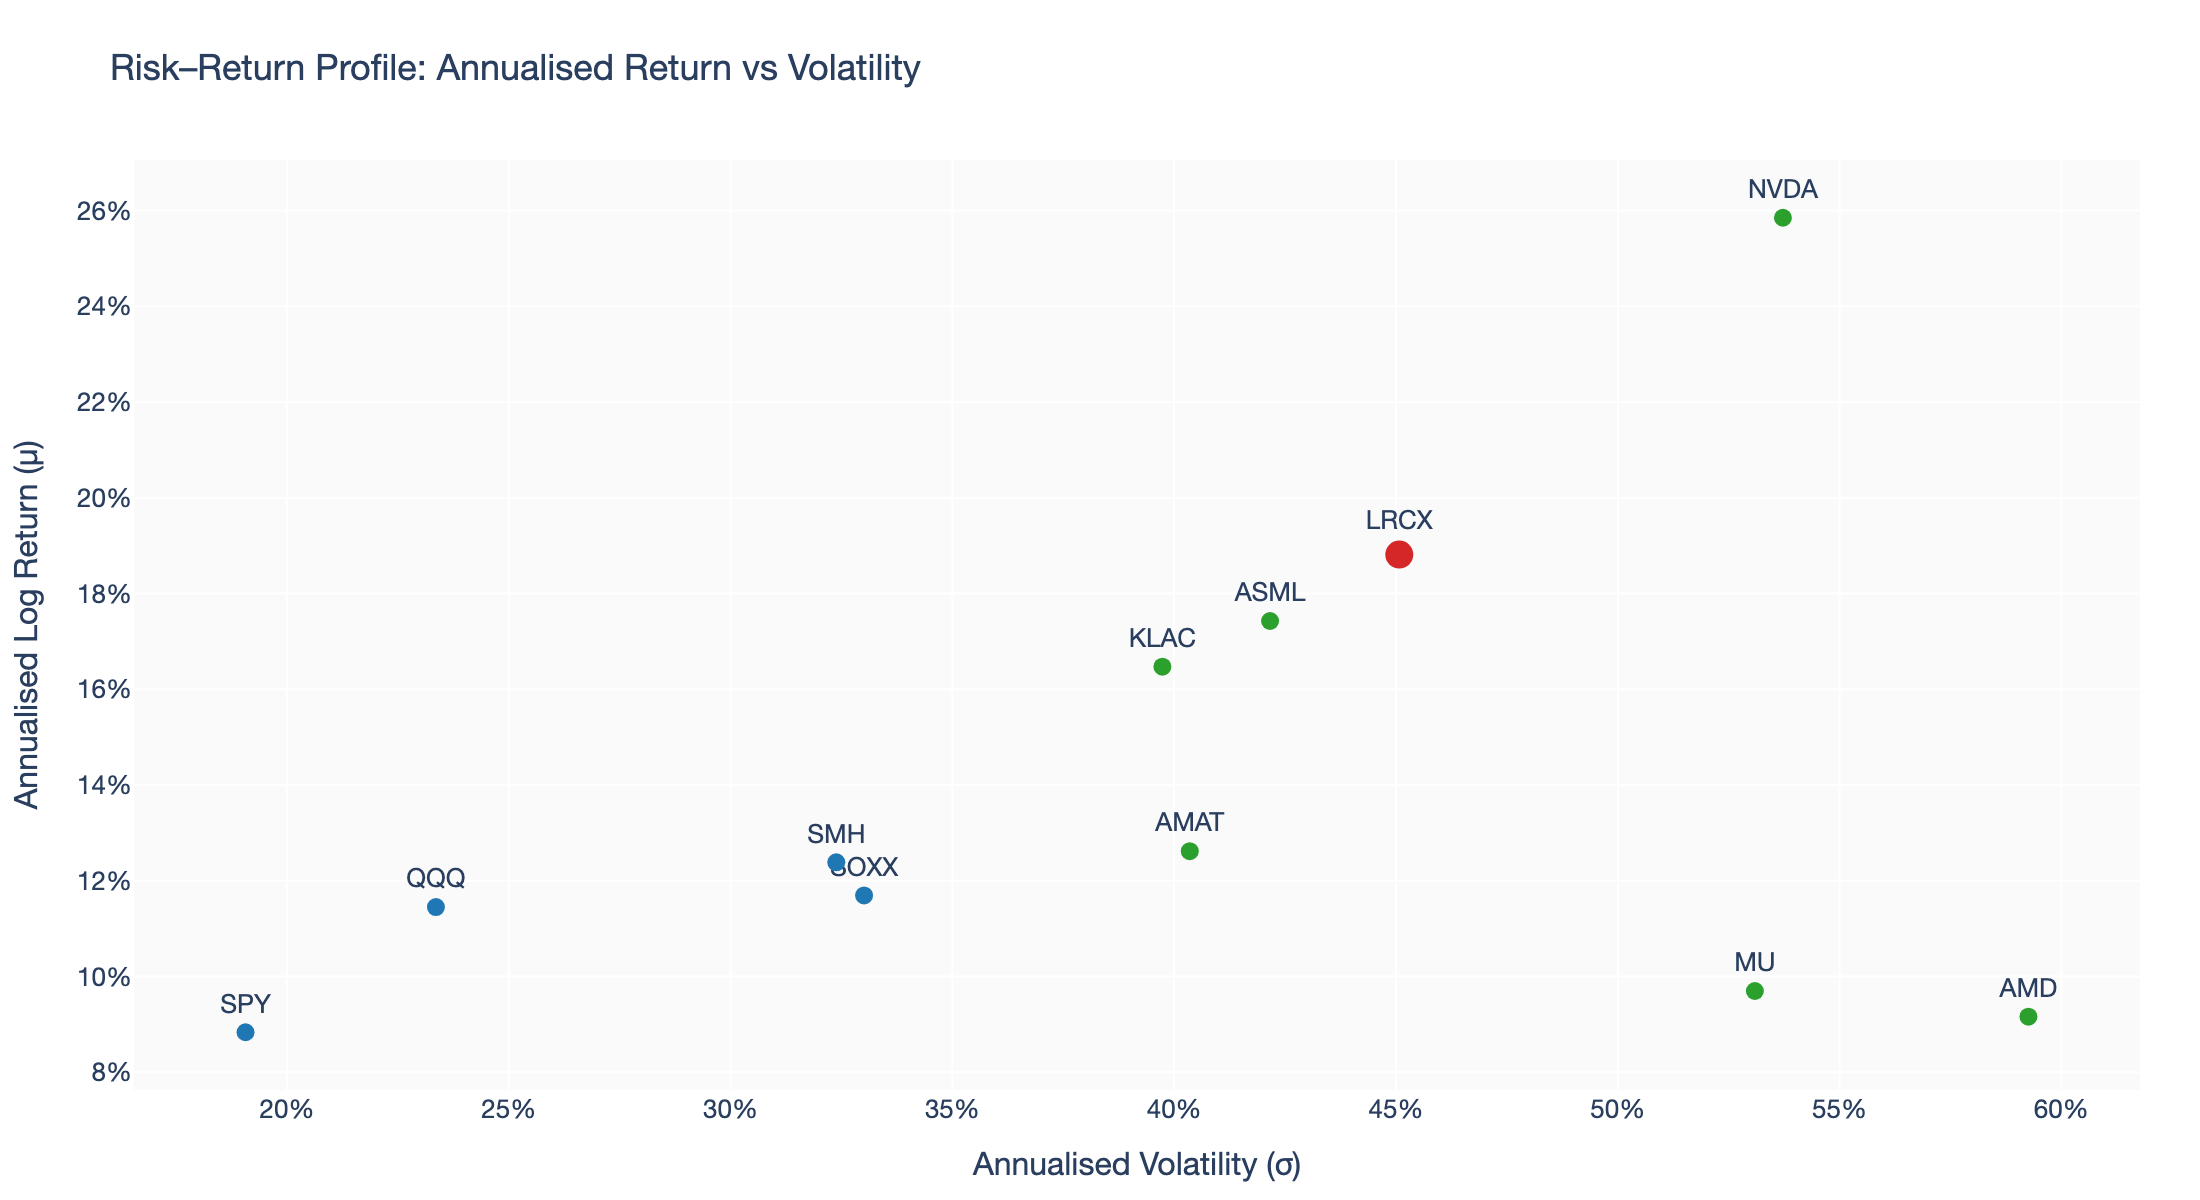
, Ann. vol , Sharpe , Sortino , Max drawdown . - Recent 2‑year snapshot (2024–2026): Ann. return
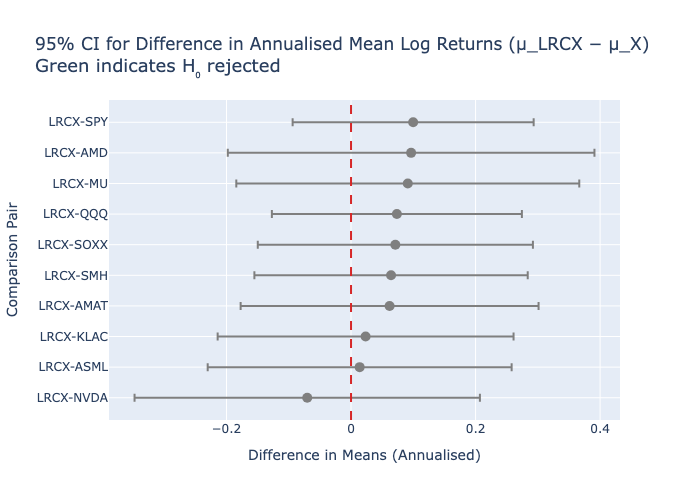
, Ann. vol , Sharpe , Sortino , Max drawdown . - Statistical tests: Welch's t-test and Mann–Whitney U (
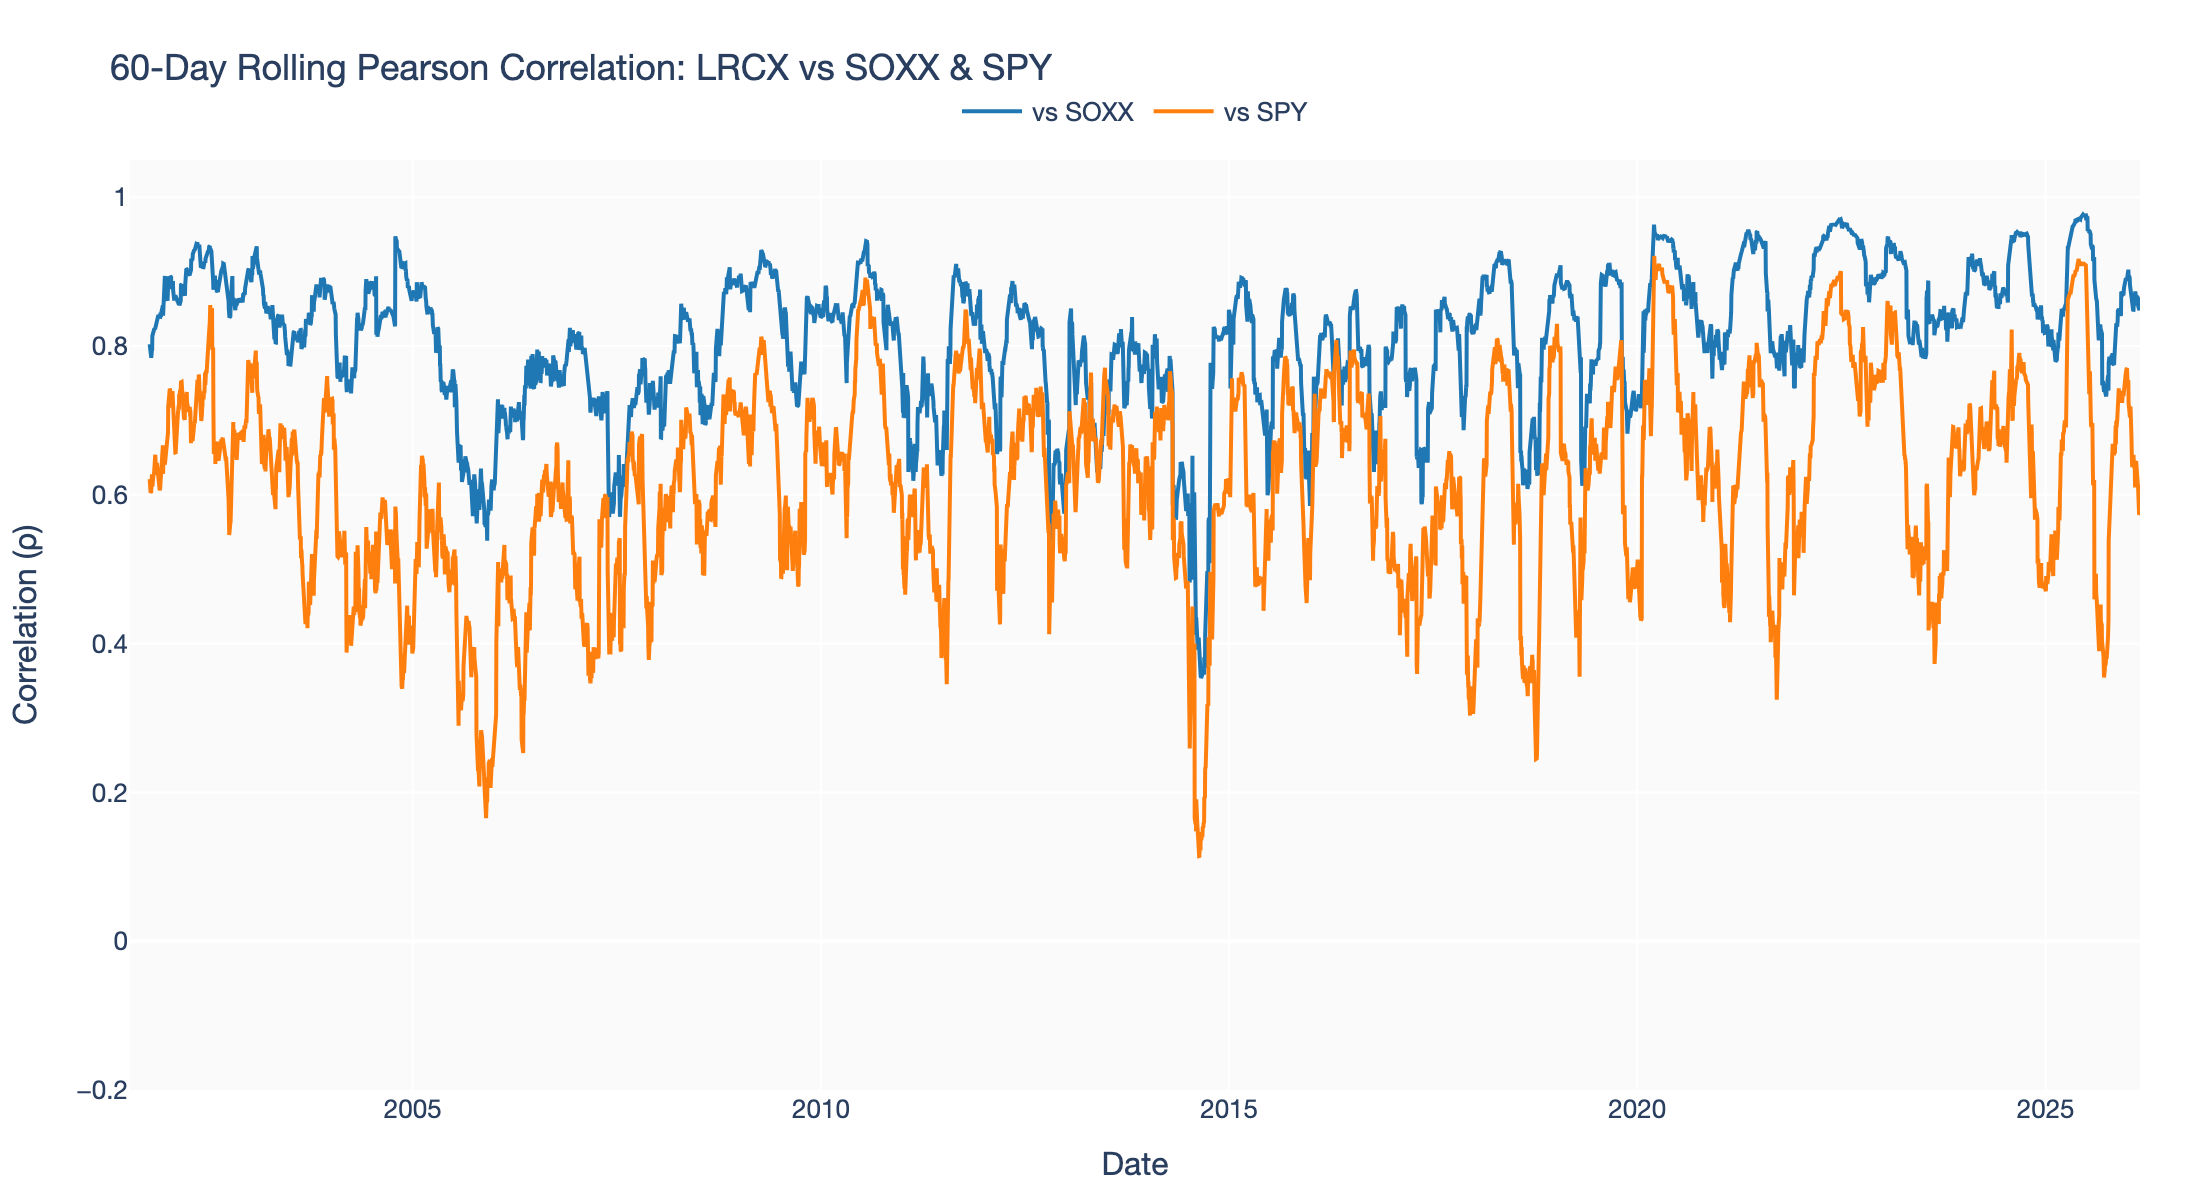
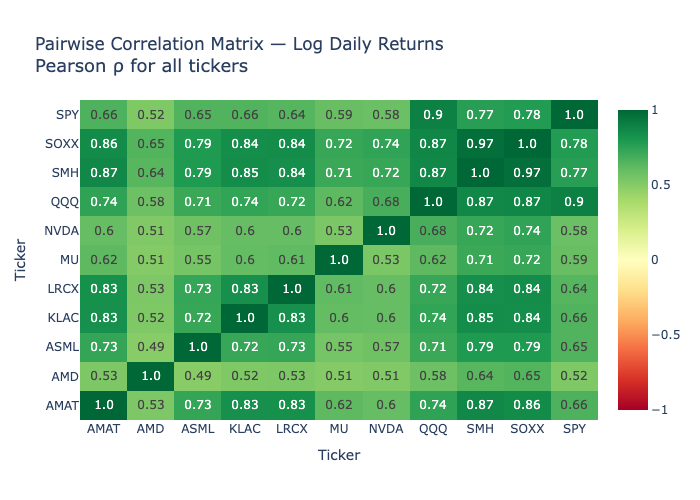
) show no statistically significant difference in mean returns between LRCX and major comparators (SOXX, SMH, SPY, QQQ, AMAT, KLAC, ASML, MU, NVDA, AMD) for both the long and 2‑year windows. - Correlation: Strong long-run correlation with semiconductor indices (Pearson
vs SOXX over full sample); rolling 60‑day correlation shows episodic decoupling during AI-capex and earnings regimes.
Key Catalysts (concise)
- Date range used for the initial narrative: Sept 2025 → Feb 2026 (see
initial_research_summary.md). - Confirmed facts:
- Q1 FY26 (Oct 2025) — revenue ~$5.32B, EPS $1.26 (beat).
- Q2 FY26 (Jan 2026) — revenue ~$5.34B, EPS $1.27 (beat); management guided Q3 FY26 revenue to ~$5.7B midpoint.
- R&D expansion: $65M Oregon facility and partnership with CEA‑Leti on compound semiconductors.
- China mix is falling; management projects China revenue
by end of 2026 (watch for gross‑margin implications).
Visualisations (embedded)
Cumulative Returns (multi-horizon)
Rolling Correlation (60-day)
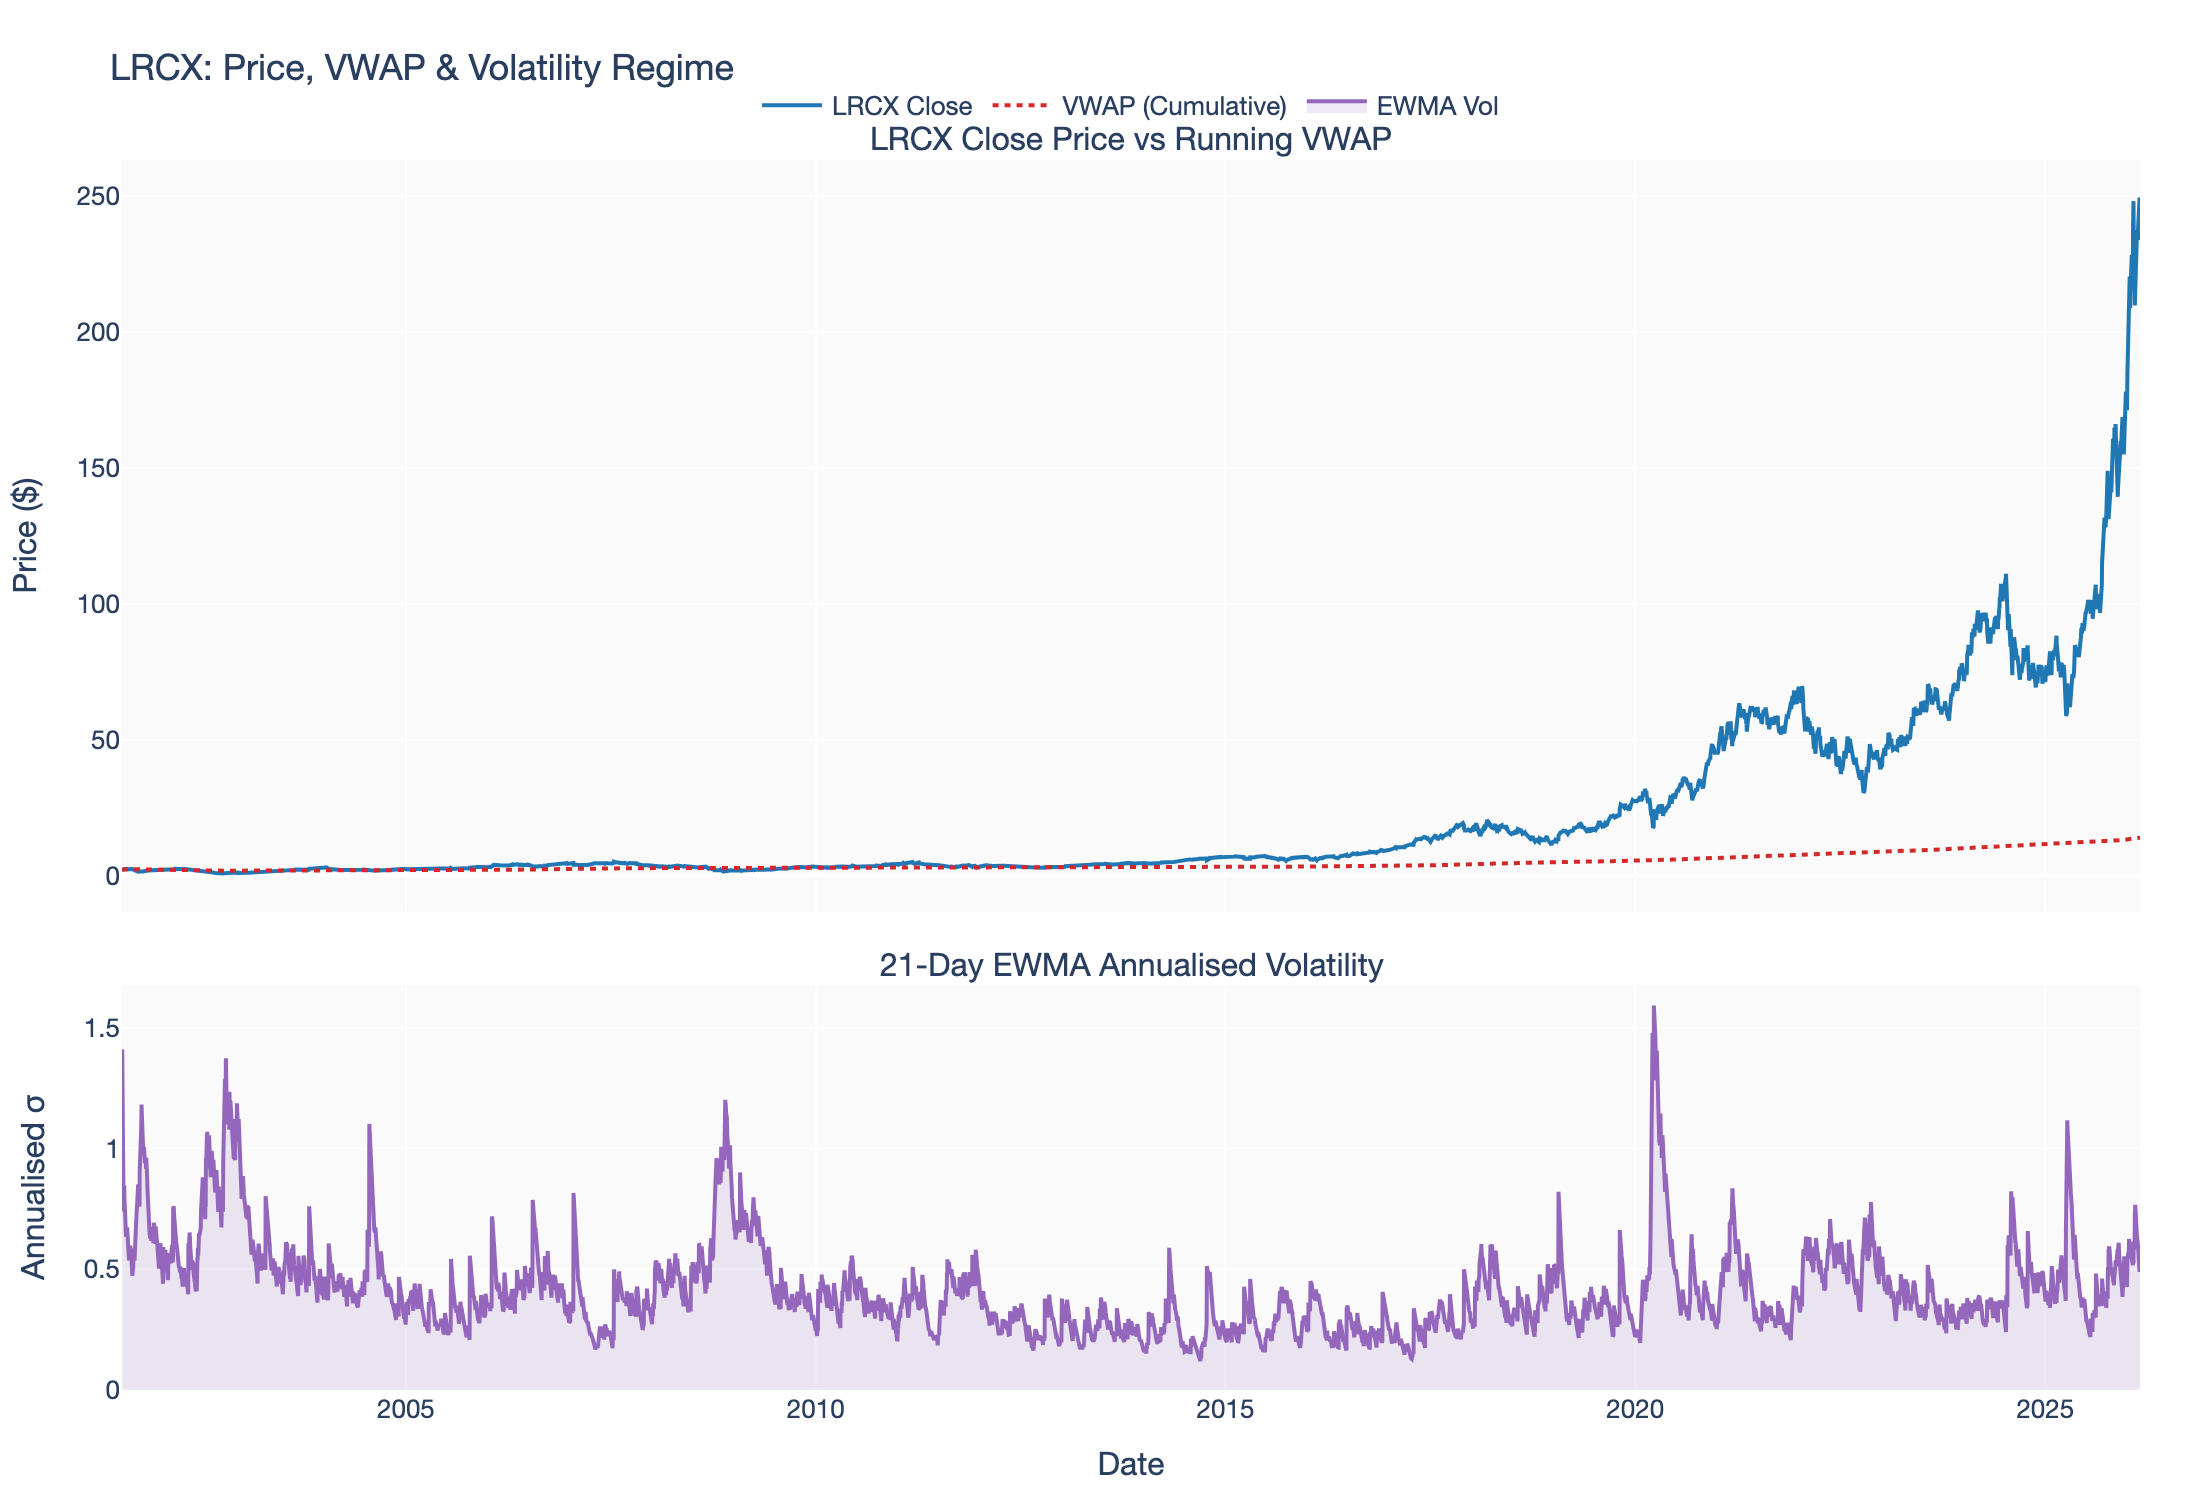
Price, VWAP & EWMA Volatility
Risk–Return Scatter
Supplementary Plots
Methodology & Definitions (notes)
- Rolling windows: 60‑day rolling correlations and betas to capture regime shifts rather than a single static correlation.
- Volatility: EWMA (exponentially weighted) volatility used to capture volatility clustering around earnings and geopolitical events.
- VWAP: used as an institutional/convection measure — persistent trading above VWAP interpreted as accumulation.
- Statistical testing: large-sample Welch's t-tests supplemented by Mann–Whitney U tests to account for heavy tails in return distributions.
What to Watch / Next Steps
- Peer read‑throughs: ASML and AMAT earnings for WFE booking signals (mid–late Apr 2026).
- LRCX guidance execution: gross margins, China revenue mix, and tool booking cadence in next quarterly print.
- Export control announcements from US Department of Commerce — potential to materially affect China‑exposed WFE demand.
Files added to vault assets (copied): 5 Obsidian/assets/chart_cumulative_return.png, 5 Obsidian/assets/chart_rolling_correlation.png, 5 Obsidian/assets/chart_lrcx_vwap_ewma.png, 5 Obsidian/assets/chart_risk_return_scatter.png, 5 Obsidian/assets/chart1_cum_return.png, 5 Obsidian/assets/chart2_corr_heatmap.png, 5 Obsidian/assets/chart3_diff_ci.png.